There has never been an event like COV19 that has impacted so many people, companies and organisations round the world.
Revenue and operational efficiency impacts
COV19 has impacted many companies from a revenue perspective as customers held off purchases and only spent money on food and essentials. In addition, COV19 has desrupted supply chains and operations for many companies.
Enterprise Agility enabled with analytics
The ability for companies to be agile and responsive during COV19 is critical for profitability as more people work from home and customers’ buying patterns have become increasingly localised.
Understanding customers’ purchase preferences across all channels has never been more important as companies need to rapidly adapt to service their customers new needs.
Spatial analytics key to financial analysis and profitability
Take me for example, I do my grocery shopping from my neighbourhood Woolworths supermarket less than 2km from where I live. While picking up my groceries, I often also pick up a bottle of wine and some beer from my nearest BWS (Bottleshop) compared to pre-COV19 where I would have travelled to the city to drink at a pub with some friends.
To illustrate this, I have used Alteryx and Tableau
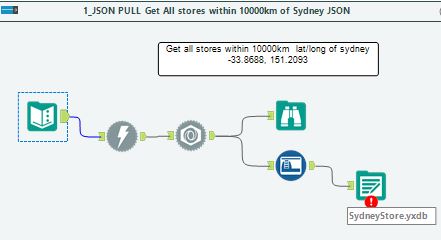
- Alteryx to scrape data from Woolworths URLhere – http://contact.woolworths.com.au/storelocator/service/proximitydetail/AU/latitude/-33.8688/longitude/151.2093/range/10000/max/10000/json
- Alteryx to parse JSON into a yxdb
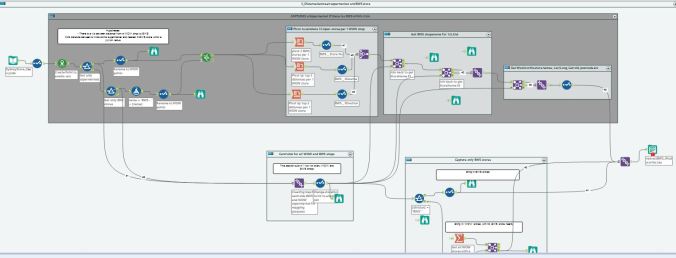
- Alteryx to calculate nearest BWS (alcohol) shop from Woolworths store
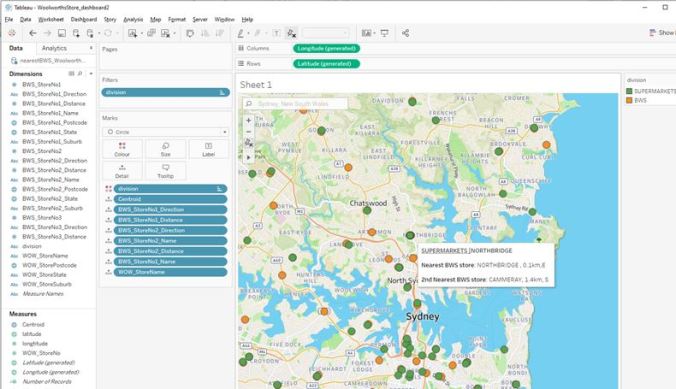
- Visualise grocery and Alcohol bottleshops here.
Alteryx to scrape data from Woolworths URL:
Alteryx to parse JSON into yxdb and then calculate distance from nearest shop
Visualise in Tableau nearest bottle shop from my neighbourhood supermarket
Previously my shopping habits include picking up groceries while taking the train on my way home but now I drive to work and order groceries online.
Using Alteryx, companies can easily see the changes in buying patterns of their customers at a street level using trade area analysis and so optimise their operations for a rapidly changing world.
Identification of high risk COV19 areas in Australia
The Australian government provides public available COV19 data however unfortunately it is all in different format. NSW provides daily cases by postcode while other states like WA and TAS only provide detail at LGA zone.
With Alteryx, any analyst can combine data from multiple areas at different granularity into a cohesive dashboard to see the impact of COV19 on people and risk areas.
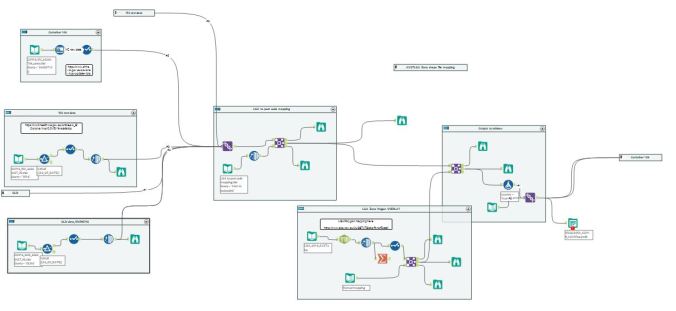
My workflow is here
Spatial analytics fun
So for those of you new to spatial analytics, remember to check out Alteryx and learn from the weekly challenges here.
I highly recommend the following challenges
- Challenge #6 Spatial Route
- Challenge #27 Spatial Telco Coverage Smoothing
- Challenge #48 Calculating Distribution Priority
- Challenge #77 Extending Spatial Lines
- Challenge #184 Closest Pubs to Tobacco Dock
- Challenge #149 Market Overlap
Check out Dr dan’s publication – Optimal location of Opioid facilities
